Hi there
Welcome to my digital home, my name is Maria Francisca. I'm from Indonesia. I'm someone who pays close attention to details and likes to take charge. I've had the opportunity to work for a national airline for 10 years, where I was responsible for making sure everything ran smoothly from start to finish, including scheduling and optimizing the use of our crew.I've learned how to maintain high standards while keeping disruptions to a minimum, which is crucial for keeping the company running smoothly and also achieving On-Time Performance goals. Along the way, I've honed my communication skills and become quite skilled at analyzing data using tools like SQL (BigQuery, MySQL) and Python. I'm also comfortable working with spreadsheets and using data visualization tools like Tableau and Looker Data Studio to tell compelling stories with the insights I uncover.In addition, I'm well-versed in various business aspects and have experience managing projects. With my analytical and problem-solving skills, I'm confident I can provide valuable insights for quick decision-making.
Understanding Business Problems
XYZ Ltd. is a large company consisting 4000 employees. We are facing serious problem related to employees. Currently our attrition rate every year is 15% resulting in vacant positions that need to be replaced with new talent that is available in the market. We need help to understand this situation and what would be the proposed solution to reduce attrition rate by next year.
Statistics & Spreadsheet
ABC Company is a property listing company in Malaysia. Their mission is to provide various available choices of property to their users around Kuala Lumpur and other big cities in Malaysia.

SQL
TheLook is a fictitious eCommerce clothing site developed by the Looker team. Sheila have emailed to understand about the business current performance (whether the business is growing, steady, or dropping).In addition to that, she also wants to know what is the key drivers breakdown per variables causing the drop/growth of the business in order to adjust the new strategy that can boost the business performance in the future.Management has decided to cut off resources in some categories with the lowest growth in the past 1 year. They also want to continue the analysis by understanding the retention behaviour of the users and how to increase the retention rate.
Python
Performing customer segmentation on Indonesian investment start-up that makes an application to enable customer buy and sell mutual funds.


Data Visualization
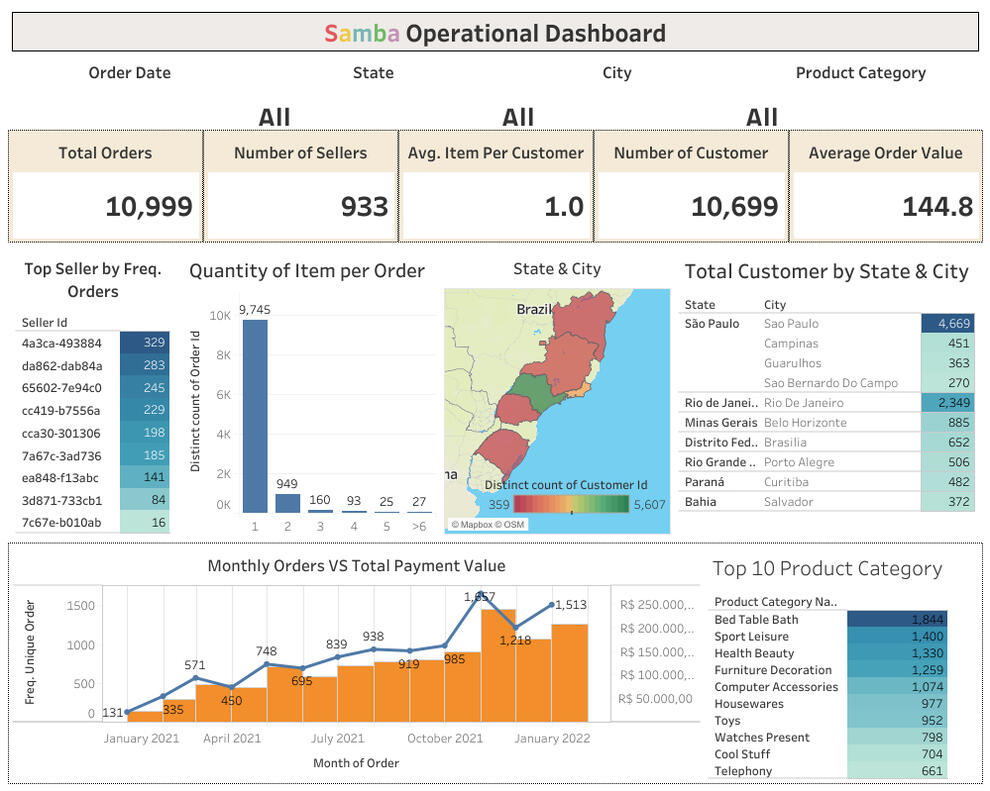
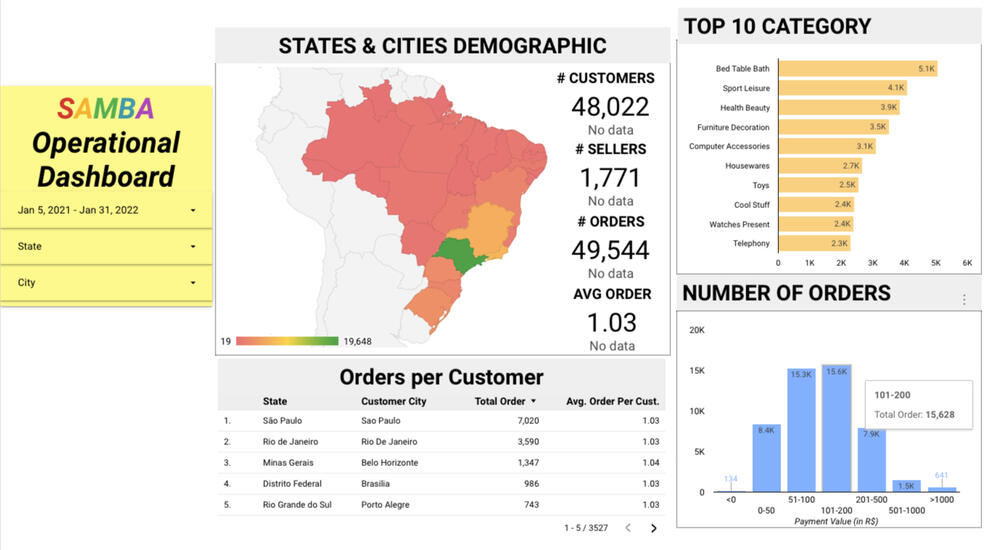
Creating dashboard for Samba e-Commerce and provide insights & recommendations
Tableau
Operational Dashboard for Samba e-Commerce using Tableau